Analysts at multiple brokerages noted that the latest sequence echoed events from April of the previous year, when sweeping tariff proposals triggered a broad sell-off before being shelved in favor of one-on-one negotiations with trade partners. After that reversal, the S&P 500 advanced roughly 37% by year-end 2025, posted several record closes and carried momentum into 2026. Many desks now view the administration’s sensitivity to stock-market performance as a key variable in policy risk assessment.
The Trump Pain Point Index flashes red
To quantify that sensitivity, researchers at BCA Research maintain a composite gauge known as the Trump Pain Point Index. The measure blends short-term equity moves, long-term Treasury yields, mortgage rates, gasoline prices, inflation expectations and the president’s approval rating. When pressures on households and markets climb, the index rises, signaling a greater likelihood the administration might recalibrate its approach.
During the latest flare-up with Iran, the index rose to roughly two standard deviations above its historical average, the highest level on record. Strategists said that reading reinforced expectations for a de-escalation, though they cautioned that any lasting improvement still depends on Tehran’s willingness to engage. So far, Iranian officials have shown limited enthusiasm for concessions that would enable the full reopening of the Strait of Hormuz.
Oil chokepoint dominates risk calculus
The strait’s strategic importance loomed large in the White House decision. According to the U.S. Energy Information Administration, roughly one-fifth of global petroleum trade passes through the narrow waterway, making it the world’s most critical oil transit route. Any prolonged disruption threatens to keep crude prices elevated, drive up gasoline costs for U.S. consumers and weigh on economic sentiment ahead of November’s midterm elections.
Crude futures surged when talk of strikes intensified and remained volatile even after the pause. Higher pump prices risk diluting the stimulative effect of recent tax refunds, a point several market observers said likely factored into the administration’s calculus. In addition, elevated energy costs tend to feed into headline inflation, complicating the Federal Reserve’s task as it seeks to balance growth and price stability.
Investor response and positioning
With volatility still above its January lows, many investors pursued hedges in gold, longer-dated Treasuries and energy-linked assets, while others selectively added equity exposure once they sensed a policy reversal might be imminent. Options markets reflected the split view: demand for downside protection remained high into the weekend of March 21–22, yet call volumes picked up on the following Monday once the strike delay was confirmed.
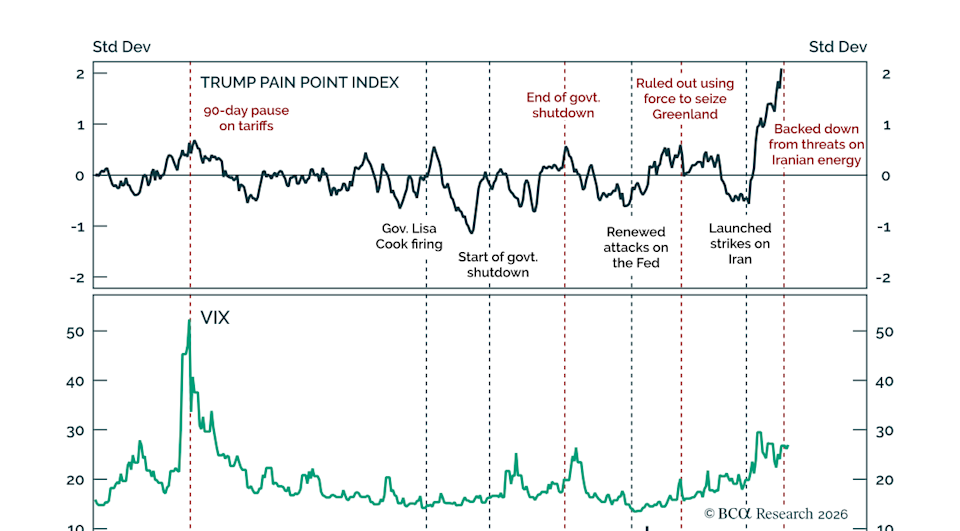
Imagem: Internet
Some asset managers see the latest episode as evidence that headline-driven swings will persist throughout 2026. They argue that even if negotiations succeed in partially reopening the strait, unresolved issues — including Iran’s nuclear posture and regional alliances — could trigger fresh flashpoints. In that scenario, the administration’s pattern of testing the market’s tolerance before retreating could repeat, leaving equities vulnerable to sudden drawdowns followed by rapid recoveries.
Comparisons with the 2025 tariff cycle
Parallels to the tariff saga remain instructive. Last April, U.S. and international equities lost ground when the White House outlined blanket import duties. The sell-off pushed key indices toward technical correction territory, lifted corporate borrowing costs and knocked the 10-year Treasury yield below key support. Within weeks, the administration pivoted to country-specific talks, easing pressure on supply chains and sparking a rally that ultimately produced double-digit returns for the calendar year.
Veteran traders now monitor policy signals, equity futures and high-frequency economic data in tandem, arguing that the TACO framework offers a practical template for navigating geopolitical risk. While no analytical tool can fully predict political decisions, recognizing the feedback loop between market pain and policy moderation has, for some, become central to tactical asset allocation.
Outlook hinges on negotiations
Whether the TACO motif retains predictive power in the current standoff will likely depend on how discussions with Tehran progress in the coming weeks. Diplomats are attempting to secure shipping guarantees that would allow crude tankers to traverse the Strait of Hormuz without military escort, a step viewed as essential for easing insurers’ concerns and stabilizing spot oil prices. Successful talks could release additional barrels into the global supply chain, reducing energy-related inflation pressures and, by extension, the Trump Pain Point Index.
Conversely, if negotiations stall or new hostilities erupt, analysts warn that crude could revisit recent highs, reigniting equity volatility and forcing the administration to weigh an even costlier set of choices. For now, the market’s verdict is mixed: equity indices remain well below their February peaks yet above the lows set during the most acute phase of war rhetoric. Treasury yields, meanwhile, have retraced only part of their flight-to-quality decline, signaling lingering caution.
In the absence of clear resolution, portfolio managers are maintaining flexible positioning, with many favoring a barbell approach that pairs growth-oriented assets with defensive holdings sensitive to oil prices and interest-rate shifts. As the calendar advances toward the midterms, few expect the underlying feedback loop between Washington and Wall Street to diminish. Instead, the probability of additional TACO-style episodes appears embedded in year-ahead forecasts, underscoring how closely policy and performance remain intertwined.


